Power Supply Control Loop Response Measurements (Bode Plot)

Your Task
To ensure the stability of voltage regulators and switched-mode power supplies, the control loop behavior must be measured and characterized. A well-compensating voltage controller enables stable output voltages and reduces the influence of load changes and supply voltage variations. The quality of this control circuit determines the stability and dynamic response of the entire DC/DC converter.
Rohde & Schwarz Solution
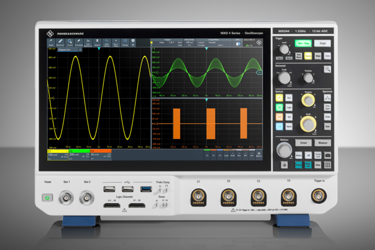
Easily and quickly analyze low frequency response on your oscilloscope with the R&S®RTx-K36 frequency response analysis (Bode plot) option. Characterize the frequency response of a variety of electronics, including passive filters and amplifier circuits. Measure the control loop response and power supply rejection ratio of switched-mode power supplies.
The R&S®RTx-K36 frequency response analysis (Bode plot) option uses the oscilloscope’s built-in waveform generator to create stimulus signals ranging in frequency from 10 Hz to 25 MHz. Measuring the ratio of the DUT signal input and output at each test frequency, the oscilloscope plots gain logarithmically and phase linearly. The R&S®RTx-K36 frequency response analysis (Bode plot) option allows you to quickly determine the gain and phase margin of switched-mode power supplies or linear regulators. These measurements help determine the control loop stability.
Get unlimited access to:
Enter your credentials below to log in. Not yet a member of Wireless Design Online? Subscribe today.
