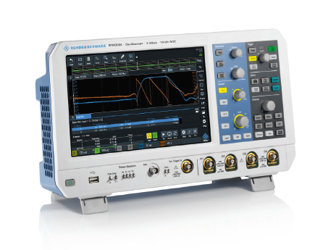
How To Analyze Passive Low Frequency Components With A Rohde & Schwarz Oscilloscope
Source: Rohde & Schwarz GmbH & Co. KG

This white paper presents a technique for easily and quickly analyzing low frequency response on an oscilloscope with the R&S®RTx-K36 frequency response analysis (Bode plot) option. The R&S®RTx-K36 frequency response analysis (Bode plot) option uses the oscilloscope’s built-in waveform generator to create stimulus signals ranging from 10 Hz to 25 MHz. Download the full paper for more information.
access the White Paper!
Log In
Get unlimited access to:
Trend and Thought Leadership Articles

Case Studies & White Papers

Extensive Product Database

Members-Only Premium Content

Welcome Back! Please Log In to Continue.
X
Enter your credentials below to log in. Not yet a member of Wireless Design Online? Subscribe today.
Subscribe to Wireless Design Online
X
Subscribe to Wireless Design Online
